If you have browsed a few listings in Falls Church and wondered why one home soars while another lingers, you are not alone. In a compact market like this, small shifts in supply, commute convenience, or condition can change value fast. This guide breaks down the local forces that move prices so you can buy or sell with confidence. Let’s dive in.
The big picture in Falls Church
Falls Church is a small, high-demand micro-market inside the Washington region. The independent City of Falls Church and nearby Fairfax County neighborhoods with Falls Church addresses create distinct price clusters. That means street-level context matters more here than broad Northern Virginia averages.
Because the housing stock is limited, inventory and buyer preferences can swing prices quickly. A single new condo building or a handful of new listings can shift competition and months of supply. You will get better insights from rolling 6 to 12 month data than from weekly snapshots.
Inventory and competition
Inventory is the number of homes for sale. Months of supply measures how long that inventory would last at the current sales pace. Lower supply tends to favor sellers through faster sales and stronger offers.
In Falls Church, the small base of homes means a few extra listings can change the feel of the market. New infill construction or a condo release along key corridors can add measurable supply at once. To monitor trends, review NVAR monthly market reports for rolling median prices, inventory, and days on market.
Commute and transit premiums
Proximity to major routes and Metro stations is a core driver of value. Living near I‑66, Route 50, or I‑495 and having easy access to East or West Falls Church Metro shortens commute time and boosts buyer demand. Walk-to-Metro remains a premium, especially for condos and townhomes.
Drive-to-Metro access still matters, particularly for single-family homes with good ingress and egress to key corridors. Traffic reliability can influence what buyers will pay. For context on stations and system coverage, explore the WMATA Metrorail map, and for roadway volumes see VDOT traffic counts.
Lot size and redevelopment potential
Lot size, zoning, and the age of the housing stock shape what a property can become. In and around Falls Church, many older homes sit on modest lots, while some Fairfax County pockets offer larger parcels. Parcels that allow expansions, accessory dwelling units, or replacement construction can command a premium.
Before pricing or offering, confirm what the lot permits and how neighbors view redevelopment. Zoning overlays and permitting timelines can affect feasibility and value. Start with the City of Falls Church zoning resources and the Fairfax County Department of Planning and Development for maps and rules.
Renovation and condition premiums
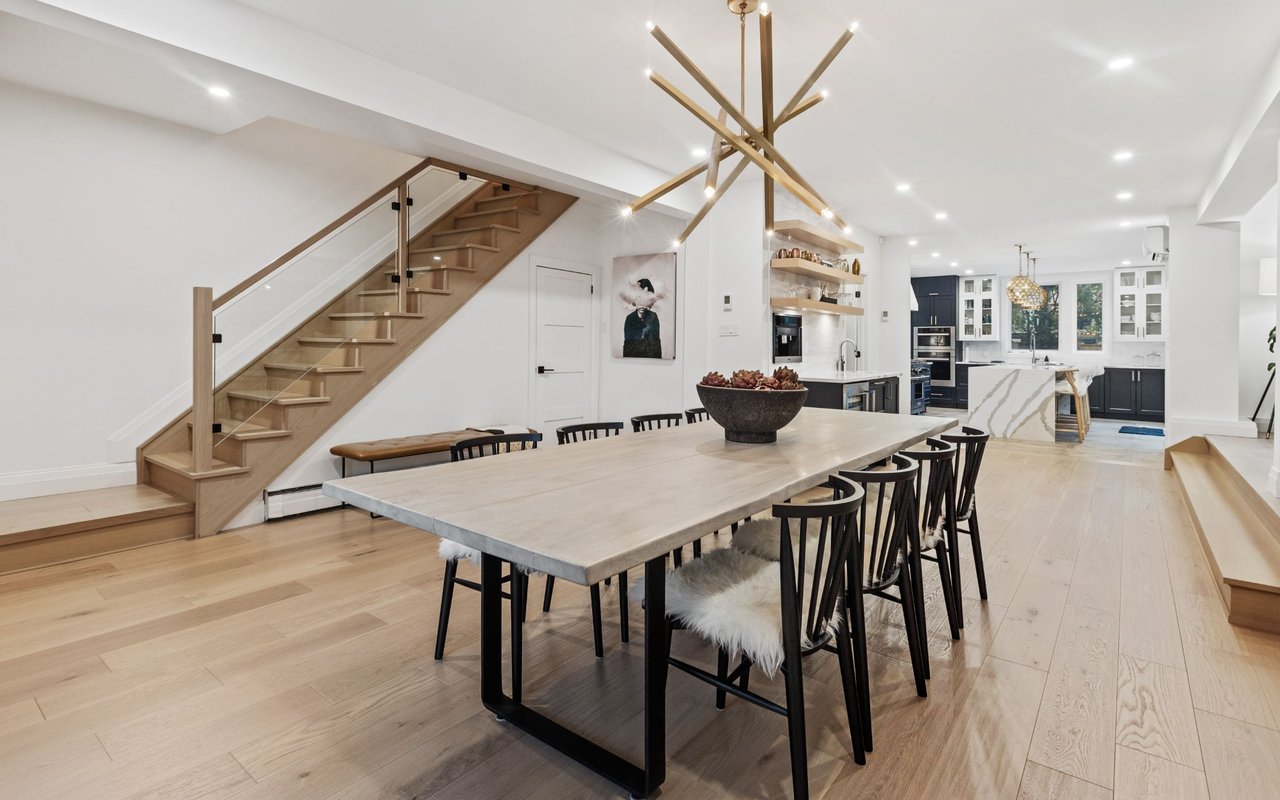
Move-in-ready homes with updated kitchens, baths, systems, and energy efficiency tend to sell faster and at higher prices. In Falls Church’s older housing stock, well-executed updates that match local tastes can widen your buyer pool.
Not all projects return the same amount. Industry studies like the Remodeling Cost vs. Value Report often show partial kitchen remodels recoup a significant share of cost, frequently reported in the 50 to 70 percent range depending on scope and region. Focus on quality and market-aligned finishes. A rushed or DIY job can undercut the premium.
Schools, walkability, and amenities
Access to strong public schools, parks, and a walkable downtown lifestyle also supports prices, especially for single-family homes. Buyers value the convenience of grocery, dining, and community events within a short walk or drive.
If schools are part of your decision, review current division information and verify boundaries. Start with Falls Church City Public Schools and the Virginia Department of Education’s School Quality Profiles for neutral performance data.
Rates, jobs, and the broader market
Mortgage rates and regional employment set the baseline for demand. The D.C. area’s federal, contracting, tech, and professional services sectors provide steady buyer traffic, while rate shifts can expand or compress buying power.
To see how financing conditions are moving, check the Freddie Mac Primary Mortgage Market Survey. Even a small rate change can adjust a monthly payment noticeably, which can influence what buyers are willing to pay at a given time.
How buyers can use these drivers
- Prioritize location by commute reality. Test your route at peak times and weigh walk-to-Metro versus drive-to-Metro based on your lifestyle.
- Value the lot and future options. Confirm zoning and potential for additions or an ADU before pricing in upside.
- Price condition correctly. Compare recent sales of renovated versus non-renovated homes in the same sub-neighborhood.
- Watch inventory trends. Follow rolling 6 to 12 month stats to gauge competition in your target micro-market.
- Verify schools and boundaries. Use official sources to confirm current assignments and any planned changes.
How sellers can use these drivers
- Lead with what buyers value most. Highlight commute advantages, walkability, lot size, and usable outdoor space prominently in marketing.
- Prepare for condition premiums. Strategic updates to kitchens, baths, paint, and lighting can improve time on market and net proceeds.
- Confirm lot specifics. Document zoning allowances, surveys, and any permits to position redevelopment upside accurately.
- Time to inventory. If supply is very low in your segment, consider listing to capture competition. If higher, lean into staging and pricing precision.
- Leverage white-glove preparation. Concierge coordination for contractors, staging, and photography can help you meet buyer expectations and maximize results.
Micro-market snapshots to track
- Rolling median sale price for the City of Falls Church versus nearby Fairfax County zip codes.
- Months of supply and active listings, broken down by property type.
- Median days on market and the share of homes selling above ask.
- Price per square foot by distance to Metro bands and by lot-size ranges.
- Pipeline of new infill or condo projects near East and West Falls Church.
Work with a local advisor
Every street in Falls Church has context, from cut-through traffic to future redevelopment plans. A tailored strategy that blends data with on-the-ground nuance will help you avoid surprises and act decisively. If you want a discreet valuation, a private exclusive approach, or full concierge preparation, let’s talk.
Request a Private Home Valuation from Peter Maser.
FAQs
Why homes near Metro in Falls Church cost more
- Buyers pay for reliable commute times and walkability, which raise demand and typically speed up sales for properties close to Metro.
How lot size affects Falls Church home values
- Larger or more buildable lots are scarce and often command premiums for space and potential expansions or redevelopment.
Whether to renovate before selling in Falls Church
- Target high-impact, market-aligned updates that improve photos and first impressions; avoid over-investing beyond what local comps support.
How small inventory changes move prices locally
- In a small market like Falls Church, a handful of new listings can change months of supply and competition, affecting both pricing and speed.
City vs. Fairfax County areas with Falls Church addresses
- The independent City of Falls Church and nearby Fairfax County neighborhoods form distinct price clusters, so use hyper-local comps when valuing.
Where to find reliable market and school information
- For market trends review NVAR reports, and for school data use FCCPS and the VDOE’s School Quality Profiles.